

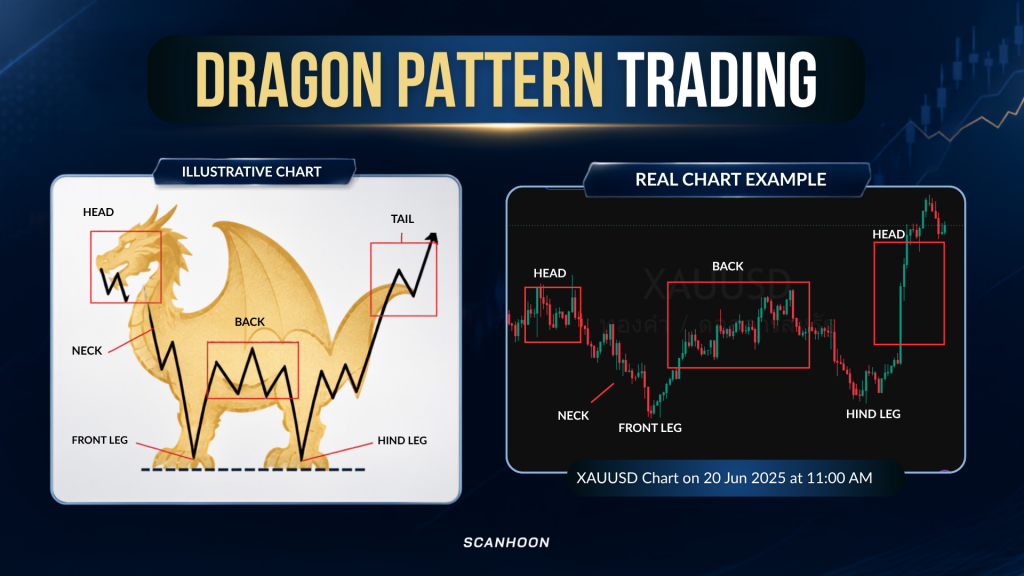
In stock market technical analysis, the Dragon Pattern is a powerful chart structure that helps traders to spot potential trend reversals. Often appearing after a prolonged downtrend, this pattern helps investors spot when a stock begins to build a base, signaling a possible shift toward a bullish trend.
The “Dragon” pattern may look complicated at first, especially with all the different parts like the Head, Neck, Legs, Back, and Tail. But at its core, it’s all about understanding price action, supply and demand, support and resistance, and how reversals form.
How the Dragon Pattern Works
The Dragon Pattern has six key parts, each showing the behavior of buyers and sellers:
1. The Head of the Dragon (The Peak)
The Head represents the high point before the price begins its descent. At this stage, buyers lose momentum while selling pressure increases.
- What to watch: The price fails to make a higher high, and the short-term trend line begins to break.
2. The Neck of the Dragon (The Downtrend)
After hitting the head, the stock enters a period of decline. The Neck forms lower highs and lower lows, showing that sellers are in control.
3. The Front Leg (Building the Base)
The Front Leg marks the initial stabilised phase. The sharp drop starts to slow down, and the price begins to find support.
- Key signal: The price stops making new lows and begins moving sideways.
4. The Back of the Dragon (Resistance Test)
As buying pressure comes back, the price bounces from the base and forms the Back. The price then moves toward an important resistance level.
It is common for the price to get rejected there and pull back a little.
5. The Hind Leg (The Final Test)
The Hind Leg helps confirm the pattern. If the stock pulls back but stays above the previous Front Leg low, it means buyers are getting stronger.
6. The Tail of the Dragon (The Breakout)
The Tail represents the potential start of a new uptrend. When the price breaks above the resistance level from the “Back,” it confirms the reversal.
How to Trade the Dragon Pattern Effectively
To avoid the common mistake of only looking for a “dragon-shaped” drawing, focus on these technical factors:
- Market Structure: Confirm that the stock has stopped making lower lows and is now starting a pattern of higher lows.
- Support & Resistance: Make sure the support at the “Legs” is strong and that the breakout above resistance is real.
- Trading Volume: Always check the breakout with increased trading volume. High volume during a breakout provides stronger confirmation of a real reversal.
- Breakout Confirmation: Do not jump in too early. Wait for the candle to close firmly above the resistance level.
Conclusion
The Dragon Pattern is more than just a shape on the chart. It helps traders see when the market may be changing direction. Watch for a move from a downtrend to a base, then a Higher Low and a breakout above resistance. These signs can help traders make more informed decisions.
Disclaimer: Technical analysis is a decision-making tool, not a guarantee of future performance. Always manage your risk, use stop-loss orders, and consider liquidity before trading.