

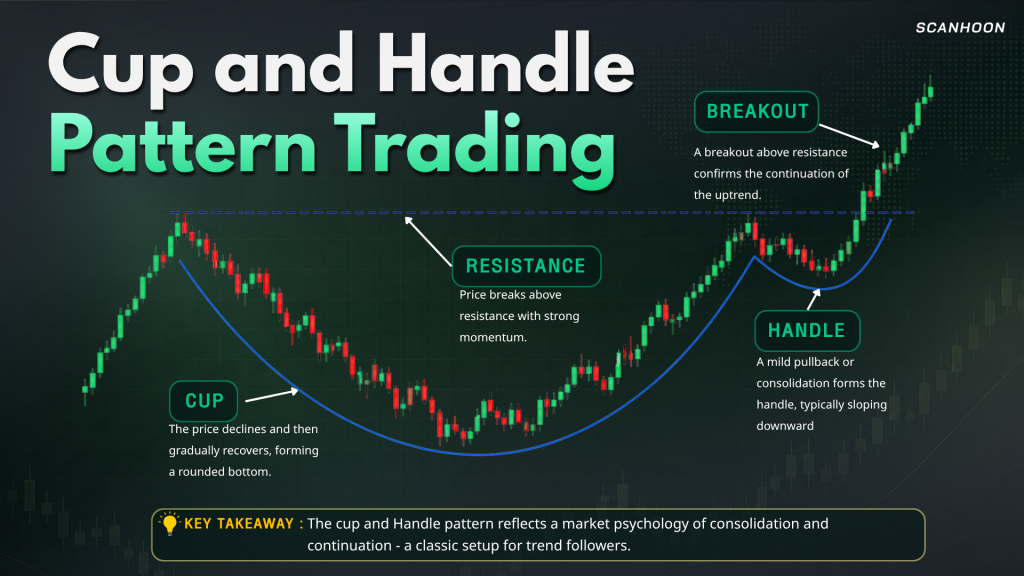
When technical analysts look at a stock chart and see a shape that looks like a coffee cup with a handle, why do they pay so much attention to it?
This pattern is called the Cup and Handle pattern, or simply the cup chart. It is a popular tool in technical analysis that investors and traders use to find possible breakout opportunities and identify when an upward trend may continue.
In this guide, we will explain what the Cup and Handle pattern is, how to read the chart, how to find entry points, and how to set a stop loss. Everything is explained in simple language so beginners can understand it in just a few minutes.
What is a Cup and Handle Pattern?
A Cup and Handle is a chart pattern that looks like a coffee cup with a handle. Traders use it to study how prices move and see if the price may continue to go up after a period of sideways movement.
The main structure is divided into two key parts:
1. The Cup
- The price gradually declines before finding support and recovering, forming a “U” shape.
- Imagine walking down a hill and gradually walking back up the other side.
- This pattern shows that selling pressure is getting weaker and buyers are becoming stronger. As a result, the price moves back up toward its previous resistance level, called the rim or lip of the cup.
2. The Handle
- Once the price approaches the rim, it may not break out immediately. Instead, it may consolidate or pull back briefly.
- This phase is known as the handle.
- Investors closely monitor this period. If the pullback remains shallow and the price breaks out above the resistance level at the rim, it signals a potential continuation of the bullish trend.
Why is the Cup and Handle Pattern Important?
The main advantage of using a Cup and Handle pattern is that it helps investors define clear trading plans, including Entry Points, Target Prices, and Stop-loss levels.
However, no chart pattern guarantees 100% accuracy. Investors should always combine the Cup and Handle with other technical indicators, such as trading volume, support and resistance levels, and moving averages.
How to Find Entry Points for a Cup and Handle
Let’s assume you spot a cup chart with the following parameters:
- Resistance or rim level at 100 THB
- Cup depth of approximately 30 THB
You can use this data to plan your basic trading strategy:
✅ Entry Point
- Instead of buying as soon as they see the cup shape, investors often wait for the price to break above the resistance level at 100 THB.
- If the breakout happens with higher-than-average trading volume, it gives investors more confidence that the price may continue to rise.
✅ Target Price
- A standard method to estimate the price target for a Cup and Handle is adding the depth of the cup to the breakout level.
- Example Calculation: Rim (100 THB) + Cup Depth (30 THB) = Target Price of 130 THB.
- Keep in mind that this target is a technical estimation and not a guaranteed market outcome.
✅ Stop Loss
- Risk management is just as crucial as finding entry points.
- Investors often use the lowest price point (Low) of the handle as a reference level for setting a Stop Loss.
- If the price falls below this important level, the Cup and Handle pattern is no longer valid, and investors should review their investment plan.
Summary: Cup and Handle in a Nutshell
Remember these three simple rules:
- Cup = Building a base
- Handle = Price consolidation
- Breakout = The key moment to watch
When you spot a Cup and Handle pattern, avoid buying only based on its visual shape. Always verify the resistance levels, breakout confirmation, volume, and proper stop-loss placement before making a decision.
The core of technical analysis is not predicting market directions with absolute certainty, but to find good risk-to-reward opportunities and prepare for unexpected market changes.